Many new investors log into their trading apps, see green or red numbers flashing, and feel a sense of unease. It looks like a scoreboard, and it feels like gambling. You buy a share at R150, and a week later it’s R155. Why? Did someone just decide it was worth more? Is it just luck?
Investing in shares is not magic, and it certainly isn't a game of chance. When you buy a share, you are buying a legal claim to a piece of a real-world business - a company with employees, buildings, patents, and customers. Share growth is simply the mathematical result of that business becoming more successful or the world becoming more optimistic about its future.
Key Takeaways
- Ownership Power: You aren't betting on prices; you are owning a "slice" of a company’s future profits.
- The Profit Link: When a company becomes more efficient or expands, your share price is the mathematical reflection of that success.
- The Double-Win: Wealth is built through two channels: the share price going up (Capital Growth) and the company sending you cash (Dividends).
- The Inflation Shield: Unlike cash, shares represent real assets that can raise prices, protecting your buying power over decades.
Level 1: The Foundation (The Owner Mindset)
Beyond the Ticker Symbol: You Own a Productive Asset
The biggest hurdle for a beginner is moving past the ticker symbol. On your screen, it’s just VOD (Vodacom) or NVDA (Nvidia). But in reality, you own a piece of every cell tower Vodacom operates or every AI chip Nvidia ships.
A Tale of Two Bakeries: Imagine your neighbour opens a bakery. You give them R1,000 to help buy a better oven, and in exchange, they give you a certificate saying you own 10% of the shop. If the bakery becomes famous and starts selling ten times as many loaves of bread, your 10% "slice" is suddenly worth much more than R1,000. That is a share in its simplest form.
When you own shares, you are an owner of a productive asset. Unlike a gold bar that just sits in a safe, or a Rand note in your wallet that slowly loses value to inflation, a company works for you. It wakes up every morning, tries to sell more products, reduce its costs, and beat its competitors. That activity is what drives the value of your investment.
The Basic Equation: Why Value is Not the Same as Price
One of the most important lessons in finance is that Price is what you pay; Value is what you get.
- Price is determined by the Market - the millions of people buying and selling every second. It can be influenced by news, a scary headline, or even a celebrity tweet.
- Value is determined by the company's "Fundamentals" - how much money it actually makes and its health as a business.
In the short term, the price might move wildly because of emotion. But in the long term, the price almost always follows the value. If a company consistently grows its profits, the price must eventually go up to reflect that reality.
Level 2: The Primary Engine - Profit & Earnings
If there is a "godfather" of share growth, it is Profit. Specifically, we look at Earnings Per Share (EPS).
Earnings Per Share (EPS): Measuring the Meat of the Business
A company might make R1 billion in profit, but if they have 1 billion shares, each share only earns R1. If they have only 100 million shares, each share earns R10. This is EPS.
As a business grows, it tries to increase this number. They do this in three main ways:
- Revenue Growth: Selling more stuff. (Opening more stores, reaching more countries).
- Margin Expansion: Making it cheaper to sell that stuff. (Using AI to automate tasks or negotiating better deals with suppliers).
- Share Buybacks: The company uses its own cash to buy back its shares and cancel them. This makes your remaining shares more rare and valuable because the profit is now split among fewer people.
You don't need to be a math genius to find this. Most finance websites (like Yahoo Finance or Google Finance) will list the EPS right on the main summary page for any stock. Look at the EPS (TTM) - this tells you how much profit the company made per share over the last 12 months. If that number has been going up for five years straight, you are looking at a growth engine in action.
The Tug-of-War: Supply and Demand
While profits drive value, Supply and Demand drive the daily price. There are a fixed number of shares for any company (e.g., Apple has about 15 billion shares). When a company announces a massive new invention or record-breaking profits, thousands of people want to buy those shares at the same time. Since the Supply is fixed, the Demand pushes the price higher. It’s exactly like a popular concert selling out - the fewer tickets (shares) available, the more people are willing to pay to get in the door.
Efficiency: Growing Without Selling More
Sometimes a share grows even if the company doesn't sell a single extra product. This happens through Operational Efficiency. Imagine a South African retailer that spends R10 to sell a shirt and sells it for R20. Their profit is R10. If they find a way to use better logistics and reduce their cost to R7, their profit jumps to R13. That’s a 30% increase in profit without needing to find a single new customer. This invisible growth is why professional investors obsess over Margins and Efficiency.
Level 3: The Income Engine - Dividends & The Reinvestment Loop
For many, the dream of investing is passive income - money that hits your bank account while you sleep. This is the world of Dividends.
Cash Distribution: The Ultimate Proof of Success
A dividend is simply a company saying: "We made so much profit this year that we don't need all of it to run the business. Here is your share of the leftover cash". Not all companies pay dividends. Younger, Growth companies (like many tech startups) usually keep every cent they make to reinvest in new technology or marketing. But older, established Value companies (like South African banks or big retailers) often pay out a significant portion of their profits to shareholders.
The Magic of DRIP (Dividend Reinvestment Plans)
The real engine for wealth isn't just receiving the dividend - it's reinvesting it. When you receive a dividend, you have a choice: spend it on a nice dinner, or use it to buy more shares of that same company. If you buy more shares, you will receive even more dividends next time, which you then use to buy even more shares. This is called a Reinvestment Loop.
| Stock Type | Primary Goal | Example |
|---|---|---|
| Growth Stock | Price Appreciation | Nvidia, Amazon, Capitec |
| Dividend Stock | Regular Income | Standard Bank, British American Tobacco |
Over a 20-year period, a huge portion of the total wealth created in the stock market comes from this loop, rather than just the price of the shares going up.
Level 4: The Macro Engine – The Economy & Inflation
Sometimes, your shares grow not because of anything the company did, but because the world around them changed.
The Tide Effect: Why a Strong Economy Lifts Average Companies
In a healthy economy, people have more disposable income. They buy more coffee, upgrade their cell phones, and take out more loans. This is the tide that lifts almost all boats. Over the last few decades, despite major dips like the 2008 financial crisis or the 2020 pandemic, the global economy has trended upward. This long-term growth is driven by innovation and a growing global middle class.
The Inflation Hedge: Pricing Power and Real Assets
Inflation is often seen as a villain, but for share owners, it can be a secret engine. If the price of bread in South Africa rises from R20 to R25, the company making that bread sees their revenue increase by 25% for the exact same amount of work.
- Pricing Power: High-quality companies can pass increased costs directly to the consumer. Because they own real assets (factories, brands, and land), their value tends to keep pace with - or exceed - inflation, whereas cash in a bank account loses its buying power every single day.
Currency Dynamics: The Rand vs. The Dollar
For a South African investor, the value of your shares is often tied to the strength of the Rand.
- Dual Growth: If you own a US-based share like Nvidia or Apple, and the Rand weakens against the Dollar, your investment grows in Rand terms even if the share price in the US stays flat.
- Local Context: Over the last 10 years, the Rand has faced significant volatility. This makes diversifying into international shares a popular way to hedge against a weakening local currency.
Level 5: The Psychological Engine - Sentiment & Valuation (Advanced)
This is the most volatile engine. It’s the reason a company can double in price in a month without making a single extra cent in profit.
The P/E Ratio: Buying Hope
The Price-to-Earnings (P/E) Ratio measures how much investors are willing to pay for R1 of profit today.
- High P/E: Investors are optimistic. They are paying a premium because they expect massive growth in the future (e.g., current AI-driven tech stocks).
- Low P/E: Investors are fearful or bored. The company might be profitable, but no one expects it to disrupt the world (e.g., many traditional banks or resource mines on the JSE).
Narrative-Driven Growth: Trends and Bull Markets
Market sentiment is often driven by narratives. Currently, the narrative is Artificial Intelligence. Companies involved in AI are seeing their share prices skyrocket because the world believes they will dominate the future economy. This bullish sentiment acts like rocket fuel, pushing prices far above what the current profits might suggest.
Level 6: Technical Deep Dive & Valuation Math
To truly understand how shares grow, we have to look at the numbers professionals use to measure success.
The Rule of 72: A Mental Shortcut
How long will it take for your investment to double? Simply divide 72 by your expected annual growth rate.
- If your shares grow at 10% per year: 72 / 10 = 7.2 years to double.
- If they grow at 6% per year: 72 / 6 = 12 years to double.
CAGR vs. Simple Returns: The Truth Number
Many people look at their portfolio and say, "I'm up 50% over 5 years!" While that sounds great, it doesn't tell you the whole story. The Compound Annual Growth Rate (CAGR) tells you the smoothed out annual rate of return.
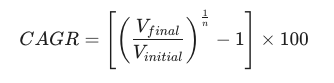
(Where n is the number of years). This is the only way to compare different investments fairly over time.
Intrinsic Value: The Fair Price
A share has an Intrinsic Value - a mathematical estimate of what it’s actually worth based on all its future cash flows.
Think of it like a house. The Market Price is what someone is willing to pay today during a bidding war. The Intrinsic Value is what the house is actually worth based on its size, location, and condition. Professional investors look for the Gap - buying shares when the market price is lower than the intrinsic value.
| Metric | Growth Play (e.g., US Tech) | Value Play (e.g., JSE Top 40) |
|---|---|---|
| Dividend Yield | Very Low (~1.2% or less) | High (~4% to 6%+) |
| Historical 5yr Return (ZAR) | ~113% | ~120% |
| Primary Driver | Innovation & Sentiment | Profit Stability & Dividends |
Conclusion: Your Next Move
Share growth isn't a mystery; it’s a machine with four distinct engines: Profits, Dividends, Economics, and Psychology. When you see your portfolio moving, don't ask, "Is the line going up?" Ask, "Which engine is running right now?" Is the company making more money? Are they paying me a dividend? Or is the world just feeling more optimistic today?
Think About It
Take ten minutes this weekend to look at your portfolio. Don't look at the prices. Look at the diversification.
- Are you too risk-averse? If you only own safe dividend stocks, you might be missing out on the engine of innovation.
- Are you too risky? If you only own high-flying AI stocks, you are relying entirely on market sentiment, which can vanish overnight.
If the market closed for the next five years and you couldn't see the prices, would you still be happy owning the businesses in your portfolio?
Cheers,
The PocFin Team